ch ch ch changes
How Global Living Conditions Have Changed Since The 1800s, Visualized


From the climate crisis to the many ongoing, brutal wars taking place across the globe, it's understandable to feel like life is, generally, getting worse. It is true that injustice and suffering persist everywhere, and we're collectively facing many great challenges — but if you zoom out, it's easier to appreciate just how far the human race has come.
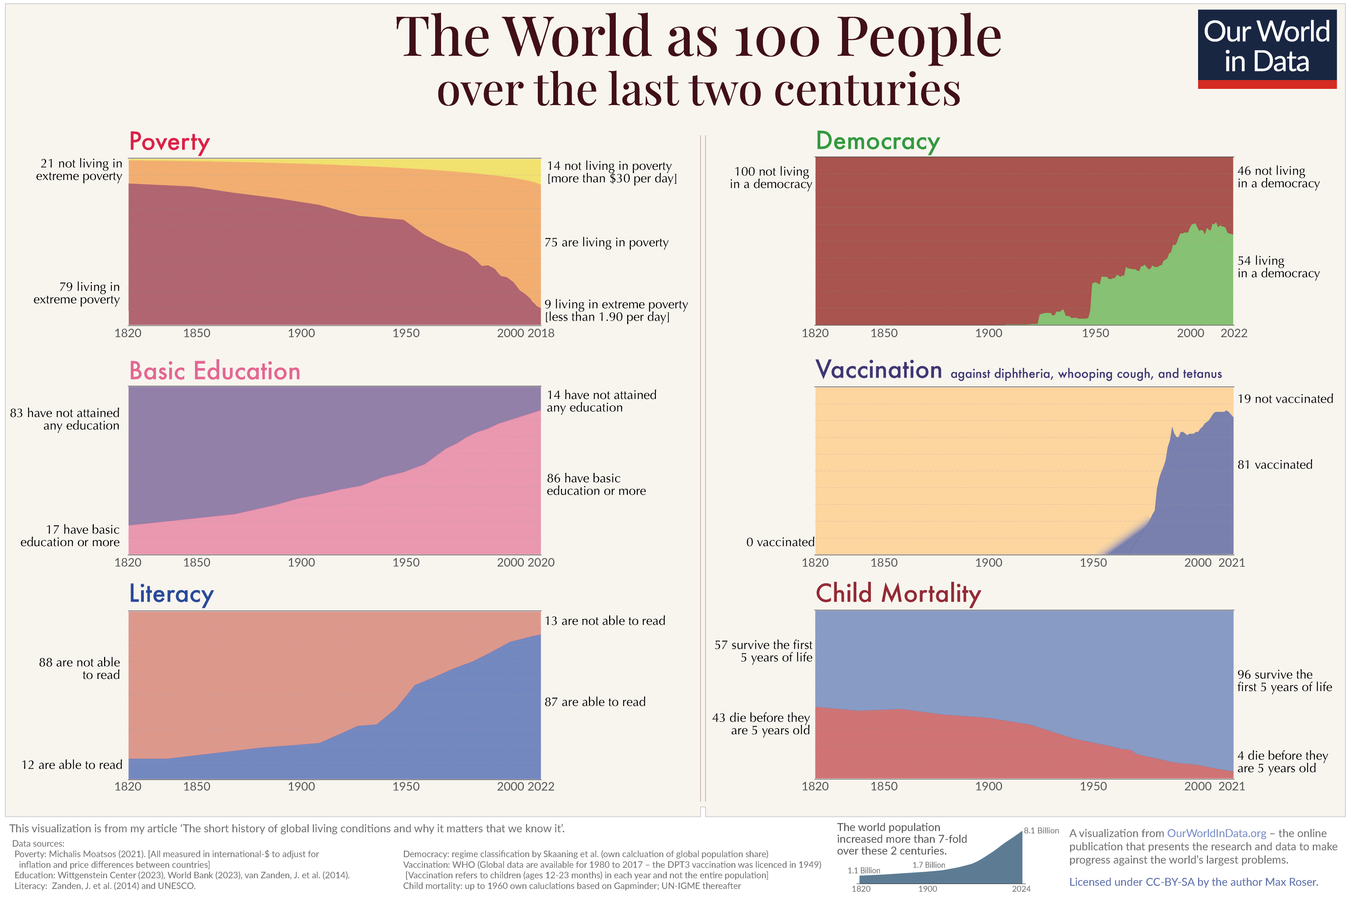
Our World In Data — a scientific publication whose work focuses on the world's largest problems, and how we can make progress against them — has analyzed and visualized data that illustrates how global living conditions have changed over the last 200 years or so. The charts below show, as founder Max Roser puts it, "a history of everyone."
Poverty
This chart is based on poverty figures that take into account non-monetary forms of income, as well as inflation and the varying price levels in different countries. The income in the chart is presented in "international dollars," which have the purchasing power of one US dollar in the US in 2011.
As you can see, just under 10 percent of the global population live in extreme poverty, or on less than $1.90 a day, as of 2018 — but that's down from a staggering 80 percent about two centuries ago.
The share of extremely poor people worldwide has decreased steadily since the 19th century, with industrialization and economic growth seeing the figure drop to around half the world's population in 1950, before falling to the roughly 8.6 percent we see today.
Literacy
Widespread education and literacy is a relatively recent achievement in human history; in 1820, just 12 percent of people aged 15 or older could read and write. By 1920, that number had crept up to around 31 percent, and today, 87 percent of the world's population is literate.
Child mortality
In 1800, around 43 percent of the world's children and babies died within the first five years of their life. As health conditions improved across the globe — thanks to things like improved diet, better sanitation and medical breakthroughs — the share of newborns surviving to at least their fifth birthday jumped to 75 percent by 1950.
As of 2021, just four percent of children worldwide die within five years of being born.
Freedom
It's difficult to measure the many different political systems used to govern countries all over the world, so this chart categorizes global regimes as either democracies or autocracies (based on an assessment by Svend-Erik Skaaning, John Gerring and Henrikas Bartusevičius which differentiates between the different types of democratic or autocratic system).
In the century between 1800 and 1900, almost no countries met Skaaning and colleagues' criteria for a democracy — and it wasn't until 1947, after WWII, that roughly a quarter of the global population was living under democratic rule.
In 2022, more than half of people lived in a democracy globally — but that's down from almost 60 percent in 2015.
Click image to enlarge