

Here's where the population grew and fell the most in the US between 2010 and 2020.
·
11k reads
·
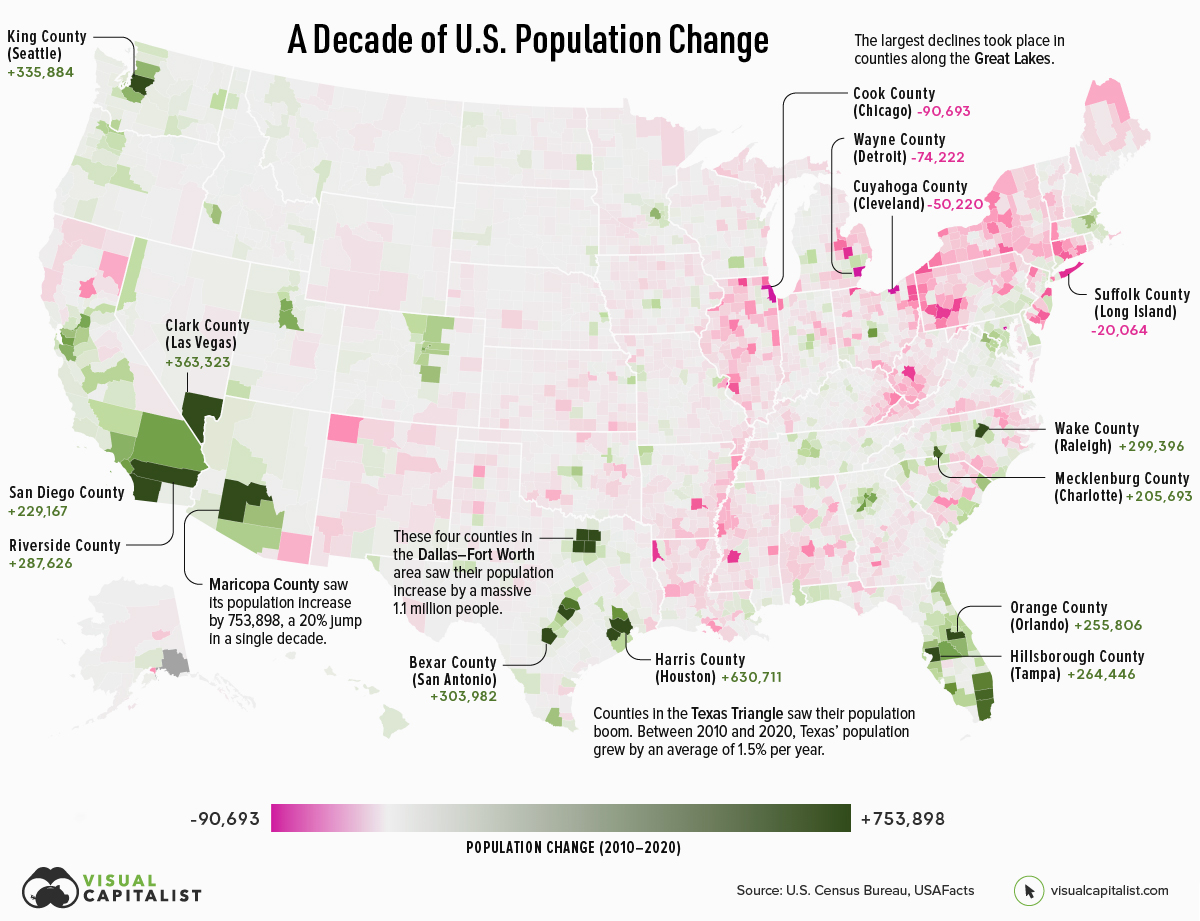
A graphic made by Nick Routley and edited by Carmen Ang shows which pockets of America had the highest population growth in the decade between 2010 and 2020. The maps use data from the US Census Bureau.
Key Takeaways
Between 2010 and 2020:
-
Two counties in America gained more than 500,000 residents: Maricopa County (+753,898) in Arizona and Harris County (+630,711) in Texas.
-
Texas counties accounted for half of the top 10 counties across America with the highest population increases, including Harris, Tarrant, Bexar, Collin and Travis Counties.
-
Cook County, near Chicago in Illinois, had the biggest decrease in population between 2010 and 2020, losing 90,693 people.
Between 2020 and 2021:
- The counties that had the highest population increases between 2020–2021 include Maricopa County (+58,246) in Arizona, Collin County (+36,313) in Texas and Riverside County (+35,631) in California.
Via Visual Capitalist.